Internal comms teams should track open rate, click rate, and read time as core engagement metrics, then add device split, segmented performance by department or location, and feedback signals like eNPS and survey response rate. Across more than 255,000 internal email campaigns, ContactMonkey’s 2026 Internal Email Benchmark Report puts the average open rate at 76%, the average click rate at 9%, and the average click-to-open rate at 10%. Open rate alone only shows who received a message. Click rate, read time, and feedback metrics show whether employees understood it and acted on it.
Ask most internal communicators what their last email’s open rate was, and they’ll know it off the top of their head. Ask what that number proves, and the answer gets a lot less confident.
Internal email metrics measure whether employees received a message, engaged with it, understood it, and acted on it. Open rate only tells you about the first of those four. Click rate gets you a little further. Neither one, on its own, tells you whether the communication actually did its job.
We hear this a lot from internal communicators. A lot of organizations talk about being data-driven, but that doesn’t always translate to internal communications. Individual IC teams are still figuring out what “data forward” is supposed to mean for their day-to-day reporting. Most communicators didn’t get into this profession to build dashboards, so it’s not surprising that reporting can feel overwhelming. When you’re looking at pages of analytics, it’s not always obvious which metrics are worth paying attention to.
This guide breaks down which internal communications KPIs actually matter, how internal email tracking works inside Outlook and what its limitations are, and how to turn a metrics dashboard into a repeatable process for improving your sends. Every benchmark referenced comes from ContactMonkey’s 2026 Internal Email Benchmark Report, based on more than 255,000 internal email campaigns, and the 2026 Global State of Internal Communications Report, so the numbers reflect what’s actually happening in internal comms right now.
What Are Internal Email Metrics and KPIs?
Simply put, internal email metrics track how well the emails you send are actually performing. For internal communications, these metrics look different from the marketing metrics most people learn first. You’re not worried about unsubscribes or list growth. Instead, internal communications metrics focus on whether employees received your message, engaged with it, understood it, and did something with it, things like open rates, click-throughs, read time, and content interaction.
KPIs are simply the handful of metrics you’ve decided matter most for a given send because they’re tied to a decision you’ll make based on the results. Not every metric needs to be a KPI, and knowing the difference becomes much easier once you group your metrics by the question they’re helping you answer.
Before any of that, it’s worth pausing on something a lot of teams skip. None of this matters much if you don’t already have an effective internal communications plan in place. Metrics only mean something in relation to an internal communications goal, and more importantly, your business outcomes. Without a plan that spells out what you’re trying to achieve and for whom, you end up picking KPIs somewhat randomly, and you won’t have a clear answer for why a given number matters when leadership asks. If you haven’t built that plan yet, that’s the place to start before you go further here.
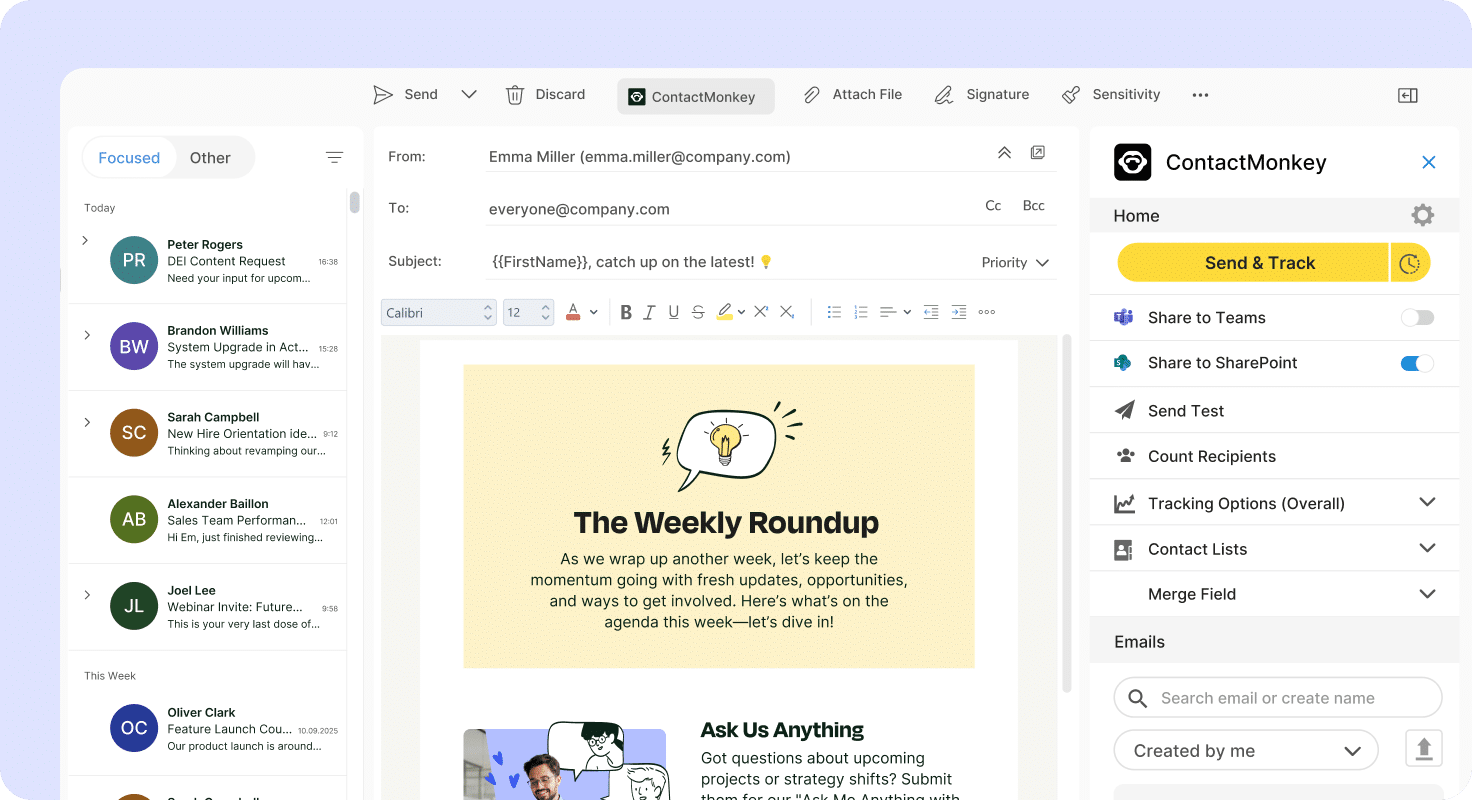
Most communicators already get a basic read from Microsoft Viva Insights inside Outlook, how many people opened an email, average time spent reading it, and whether recipients opened a linked or attached document. ContactMonkey’s Outlook integration builds on that with a fuller set of insights: click rate, click-to-open rate, device breakdown, click maps, and individual-level engagement (when enabled), all without ever leaving your inbox, so the four levels below are numbers you can actually pull up after every email.
The 4 levels of internal email measurement
1. Reach: who got it. Delivery rate and open rate. This tells you whether the email showed up in front of the right people at all, before you ask anything else of it. Bounce and suppression data is also available here, through a recurring Suppressions Report from ContactMonkey Support, which lists bounced and blocked addresses and flags who won’t receive future sends until they’re cleared.
2. Engagement: opened, clicked, or read. Click rate, click-to-open rate, and device split. This is where you find out whether people did anything with the email once it landed, or whether it sat there unopened.
3. Understanding: a comprehension proxy. Read time, paired with any quick feedback you’ve built in, like a one-tap “was this clear?” reaction or clicks through to a linked FAQ. You can’t directly measure whether someone understood a message, but read time and micro-feedback get you close.
4. Action: CTA completion and business outcomes. Clicks on the actual call to action, survey completions, event RSVPs, or a downstream outcome outside the email entirely, like a policy acknowledgment or benefits enrollment. This is the level leadership actually cares about, and the one most internal communications KPIs stop short of measuring.
Tracking the right metric at each level gives you a much clearer answer to the question, “Did that land?” Send a pulse survey after a change announcement, and you’ll find out directly whether people understood it. That feedback is also what lets you tweak the next send instead of repeating whatever didn’t work. With a clearer read on what’s working and what isn’t at each of these four levels, you can start using internal communications metrics to actually shape strategy.

Which Internal Email Metrics Should You Be Measuring?
Your question right now is probably something like “What metrics should I use to measure internal communications effectiveness?” or “How can I measure employee engagement?” Maybe it’s even, “Is there a way to see who read my internal email?” We’ll answer all of those. For now, let’s start with the metrics themselves: what they measure, why each one matters, and what a realistic number looks like today.
Here are the most important metrics for your IC team to track regularly:
1. Open rate
Open rate is the percentage of people who opened your email. You can write the most useful internal update of the year, but if nobody opens it, none of that content ever reaches anyone. That’s why knowing exactly when an email was opened, and by whom, is one of the first things any internal communications metrics program should have visibility into.
Open rate depends on a mix of factors: your industry, your company culture, subject line quality, and how many emails you’re already sending that week. According to the 2026 Internal Email Benchmark Report, drawn from more than 255,000 internal email campaigns, the average internal email open rate now sits at 76%, and organizations with smaller, more targeted recipient lists (50 recipients or fewer) see that climb to 89%.
Sometimes a low open rate isn’t a content problem at all. Flagger Force, a traffic control services company with a large frontline workforce, found that employees were marking their internal bulletins as phishing, which meant important safety updates weren’t getting read in the first place. After switching to ContactMonkey for more reliable Outlook delivery and clearer analytics, the team saw open rates increase by more than 40%.
“[The analytics] are fantastic,” says David Rosati, Internal Communications Specialist at Flagger Force. “Literally no issues with them, and the display of them is so much better than what we were getting in the past.”
Unique opens vs. total opens
Unique opens and total opens tell you two different things about employee engagement. Unique opens show how many employees opened your email at least once. Total opens count every open, including employees who came back to the same email multiple times.
Comparing the two can be surprisingly useful. If employees keep coming back to the same email, it usually means one of two things. The information is valuable enough to revisit, or people are looking for clarification. Both are worth paying attention to, especially for communications like benefits enrollment, policy updates, or company-wide announcements.
2. Click rate (CTR)
Click rate is the percentage of recipients who clicked a link in your email. It’s a meaningfully stronger signal than open rate, because a click means someone engaged with the content enough to want more, whether that’s reading further, taking an action, or following up on something specific inside the email. Opens just mean the email showed up. Clicks mean the audience is actually engaged.
CTR also tells you which parts of your content are working. If you notice your event calendar gets more engagement once it’s moved higher in the email, or that a training announcement drives more sign-ups when it’s paired with a short video instead of plain text, that’s CTR doing its job.
Across the industries analyzed in the 2026 Internal Email Benchmark Report, the average click rate sits at 9%, with click-heavy sectors like Not-for-Profit and Insurance both averaging 13%, largely because their internal emails tend to require an action: a policy acknowledgment, a compliance deadline, a survey response.
This is also where email tracking for internal communications starts to matter more than open rate ever will. You can have a strong open rate and a flat CTR, and that combination usually points to a content or CTA problem.
3. Read time
If you’ve ever rewatched a favorite movie, you already know people spend more time with things they actually care about. Read time works the same way. It’s the length of time someone spends with your email once it’s open, and it’s one of the better proxies you have for whether content is actually landing, not just getting glanced at.
ContactMonkey splits read time into three bands: glanced (1 to 3 seconds), skimmed (more than 3 to 9 seconds), and read (more than 9 seconds). Across all industries, 44% of opens fall into the “read” category, which is a far more honest signal than open rate on its own. An email can hit a 90% open rate and still only be getting glanced at by most of the people who opened it.
Read time helps you answer a question open rates can’t. Did employees actually spend time with the message, or did they just open it and move on? If a policy update or benefits announcement is consistently getting glanced rather than read, that’s worth flagging before you assume the message actually landed. Long-form updates, leadership messages, and anything with real consequences for missing a detail are exactly where read time matters more than open rate.
4. Device split (desktop vs. mobile)
Knowing whether employees are reading your emails on desktop or mobile shapes almost every other decision you make about formatting, and it’s one of the more overlooked internal communications metrics on this list.
Desktop still accounts for 84% of internal email engagement industry-wide, largely because so much internal communication happens through Outlook and Microsoft 365 during the workday. But that average hides real variation. Mobile share climbs to 31% in Transportation and Trucking, 24% in Education, and 21% in Agriculture, Pharmaceuticals, and Utilities, industries with field-based, clinical, or frontline-heavy workforces who aren’t sitting at a desk when your email lands.
Once you know how employees are reading your emails, you can make small changes that improve the experience. A workforce that mostly reads on mobile has different needs than one that’s sitting at a desktop all day.
5. Bounce rate and delivery rate
One bounced email isn’t a big deal, but if you’re seeing a pattern of bounced emails, that’s worth paying attention to. Over time, it can affect your sender reputation and make it harder for future internal communications to reach employees.
When a bounce happens, your server typically flags it as one of two types:
- Soft bounce: a temporary issue, like a full inbox or an email that’s too large. Usually worth a retry.
- Hard bounce: a permanent issue, like an inactive or incorrect email address. A sign your distribution list needs cleanup.
ContactMonkey Support can set up a recurring Suppressions Report, delivered on a schedule, that lists every bounced and blocked address and flags who won’t receive future sends until they’re cleared. It’s worth requesting if bounce patterns are a concern, since a portion of your audience never receiving an email in the first place can look identical, on the surface, to a weak subject line or underperforming content, and it’s a much easier problem to rule out first.
6. Segmented email stats by department, job title, and office location
We’ve seen plenty of teams celebrate a healthy overall open rate, only to discover later that certain departments or locations were barely engaging. That’s why it’s worth looking at engagement by audience, not just across the organization as a whole.
This is why segmentation deserves a place in any serious internal communications program, not as a nice-to-have, but as the difference between knowing something isn’t working and knowing exactly where and why. Breaking results down by department, job title, and office location lets you see engagement patterns that a blended number will always average out. Frontline employees might consistently open at a lower rate than corporate staff, simply because they’re checking email from a shared kiosk between shifts instead of a desktop parked open all day.
In her piece on the employee engagement trends redefining the workplace in 2026, internal communications expert Alyssa Towns points out that personalization is no longer optional in internal comms. Employees now spend most of their day inside consumer experiences that are highly targeted, relevant, and concise, and that shapes what they expect from the emails their employer sends too. A generic, one-size-fits-all newsletter competes with a personalized experience they get everywhere else, and it tends to lose.
With ContactMonkey, this kind of segmentation doesn’t require pulling data into a separate spreadsheet. Audience segmentation lets you filter any campaign by department, location, or role directly inside your analytics dashboard, so you can see, for example, that employees in one country aren’t opening or clicking nearly as much as employees elsewhere, and start investigating why. That segmentation view makes it easier to spot patterns across departments, so you can tailor future communications based on how each group is engaging.
7. Employee feedback metrics
Employee feedback metrics measure something the rest of this list can’t: what employees actually think, not just what they clicked on. Survey response rates, emoji reactions, eNPS scores, and anonymous comments give employees a way to talk back, and that’s worth measuring in its own right.
According to GSIC 2026, 95% of organizations now collect feedback in some form. Collecting employee feedback is the easy part. Only 15% of organizations say they clearly communicate what they did with that feedback, while 31% describe their follow-up as inconsistent or delayed. Employees notice when they’re asked for input and never hear what happened to it. Tracking response rates and following up on the actions you take gives you a much clearer picture of whether employees believe their feedback is making a difference.
Many employees still don’t feel fully comfortable speaking openly at work. In GSIC 2026, only 39% of respondents said employees feel comfortable sharing honest feedback upward, another 39% said somewhat comfortable, and 17% said uncomfortable. How you ask for feedback matters as much as whether you collect it at all, and anonymous surveys often lead to more candid responses.
ContactMonkey builds this into the email itself instead of sending people to a separate tool. You can embed pulse surveys, eNPS questions, emoji reactions, and anonymous comments directly inside an Outlook or Gmail send, and the results land in the same analytics dashboard as your open and click data. In the 2026 Benchmark Report, eNPS surveys embedded this way produced an 11% click rate and 11% click-to-open rate, both ahead of the general benchmark, largely because employees can respond without leaving the email.

8. Open time and engagement distribution timeline
Knowing when your employees are actually opening your emails is one of the more underused internal communications metrics on this list, and it directly shapes how much of your other data means anything at all.
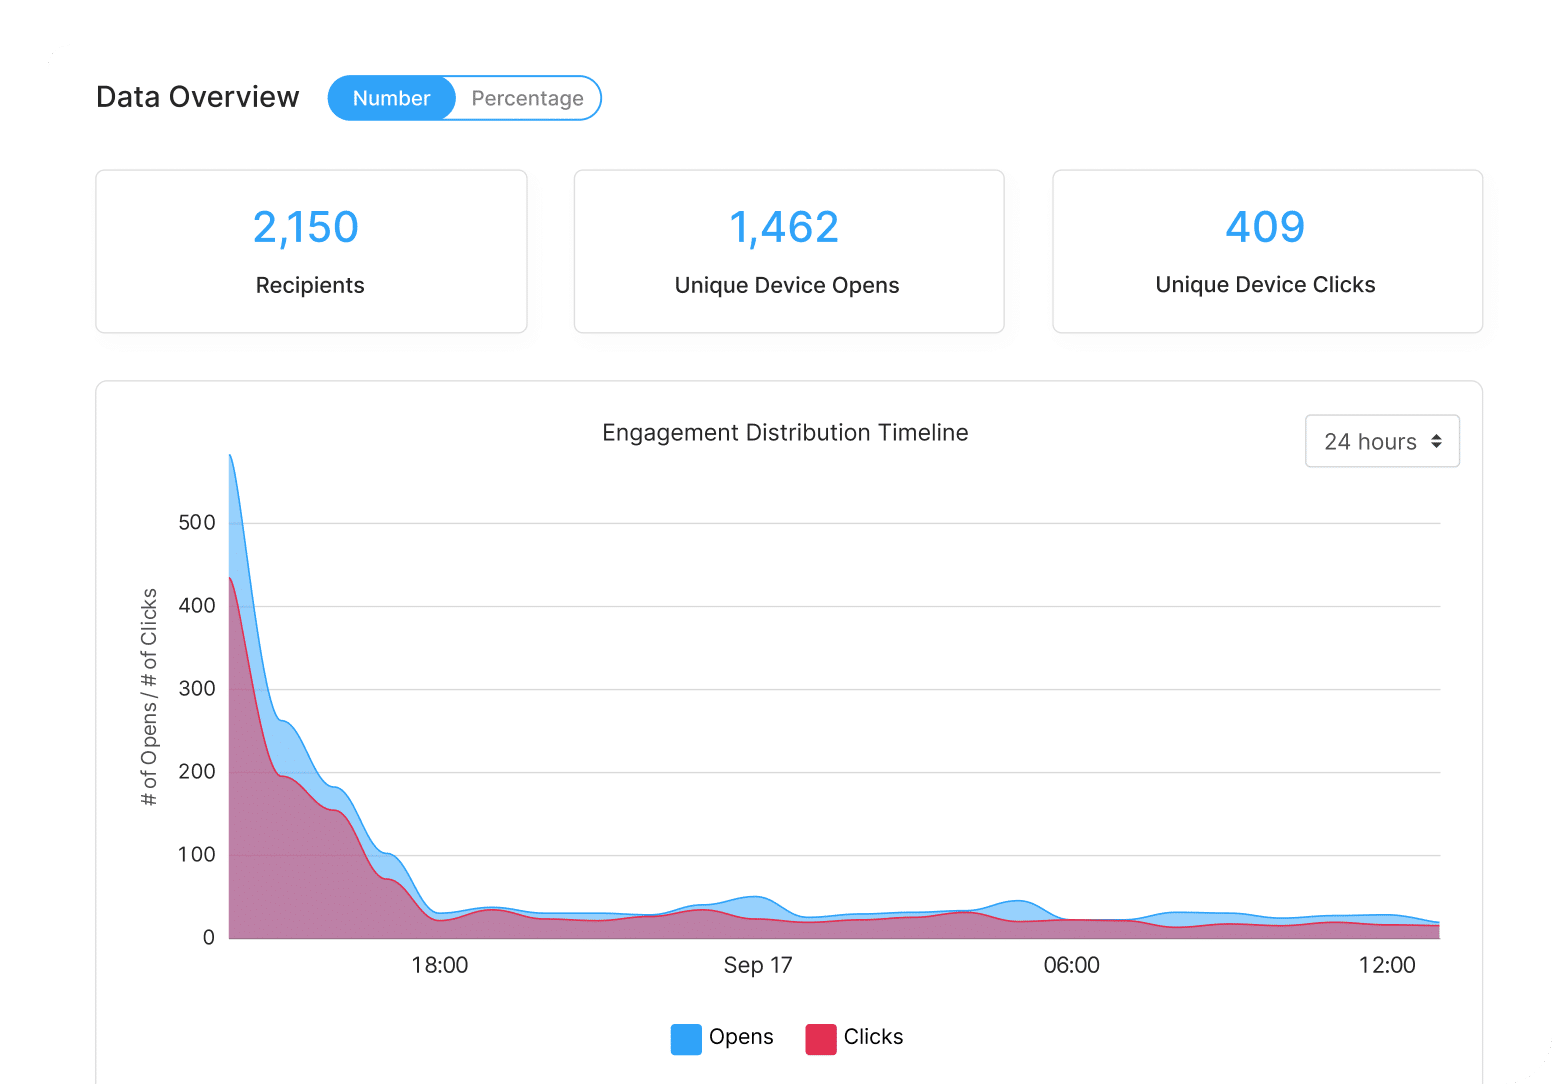
If your email isn’t opened within the first hour or so after sending, it’s usually not getting opened at all. Every other message landing in that inbox afterward pushes yours further down, and by the next morning, it’s competing with a full day’s worth of new arrivals.
ContactMonkey’s Engagement Distribution Timeline shows exactly when recipients open and click a given email, broken down hour by hour. The pattern you want to see is a sharp spike in activity right after you hit send, which means the message reached people while it was still sitting at the top of their inbox. A flat or delayed curve usually means your send time is working against you, not your content.
Once you’ve run this across a few campaigns, patterns start to show up. If your employee newsletter consistently spikes on Tuesdays at 11:00 AM, that’s a strong signal to send closer to 10:50, so the email is already landing right as that engagement window opens, instead of arriving after it. The 2026 Benchmark Report found that the best send times vary by industry and region once emails are viewed in each employee’s local time zone. There’s no universal best time to send. The right time depends on your workforce, which is why it’s worth looking at your own engagement data before changing your schedule.
9. eNPS (Employee Net Promoter Score)
eNPS measures how likely employees are to recommend your organization as a place to work, based on a single question: “On a scale of 0 to 10, how likely are you to recommend this organization as a place to work?” The score is the percentage of promoters (9 or 10) minus the percentage of detractors (0 to 6). On its own, eNPS is a culture metric, but embedded inside an internal email, it becomes one of the more efficient internal communications metrics you can track. It captures sentiment in the same moment someone is already reading your email, instead of asking them to click through to a separate survey tool later.
With ContactMonkey, you can drag an eNPS survey directly into an email from the template builder, and results land on the same Campaign Analytics page as your open and click data. In the 2026 Benchmark Report, eNPS surveys embedded this way produced an 11% click rate and 11% click-to-open rate, both ahead of the overall 9% click rate and 10% click-to-open rate. That fits a GSIC 2026 finding that only 39% of respondents say employees feel comfortable sharing honest feedback upward, so a low-effort, in-the-moment way to respond makes a difference.

10. Link and content engagement
Click rate tells you whether people clicked. Link and content engagement tells you what they clicked on, and that distinction is where a lot of useful decisions actually get made.
Knowing your best-performing links lets you see exactly which piece of content pulled people in, whether that’s a benefits update, an event registration, or a leadership video. With ContactMonkey, you can see how many people clicked each individual link in an email, right inside your new customizable analytics dashboard, so you can compare which links performed better than others instead of just knowing your overall click rate. Once you know that, you can build future sends around what’s already proven to get attention.
11. Click maps
Open rate and click rate measure overall engagement, but they don’t tell you anything about what happened once someone was actually inside the email.
ContactMonkey’s click maps show a visual overlay of exactly where employees clicked within an email, section by section. That’s a different kind of insight than a click-through count. It tells you whether people are engaging with the header image, skipping straight to a specific link, or ignoring an entire block of content you assumed was working. Click maps can tell you a lot about how employees are reading your emails. If almost all of the engagement happens in the first couple of sections, it’s worth moving your key messages higher up.

What internal email metrics matter beyond opens and clicks?
Open and click rate show reach and interest, but they don’t show understanding or action. Read time, eNPS embedded in the email, survey response rate, and segmented performance by department or location fill that gap. In ContactMonkey’s 2026 benchmark data, eNPS surveys embedded in email average an 11% click rate and 11% click-to-open rate, both above the overall 9% click rate.
Ask your email analytics questions in plain English
See the AI Insights Assistant in a 2-minute tour.
Start Insights tour

How Do Internal Email Open and Click Rates Compare by Industry and Audience Size?
Benchmarks vary widely by industry and by audience size, so a single average open rate is a rough starting point, not a target. The table below comes directly from ContactMonkey’s 2026 Internal Email Benchmark Report, based on more than 255,000 internal email campaigns across 20+ industries. Use it alongside your own internal email tracking data to judge whether a number is strong for your organization.
| Segment | Avg. open rate | Avg. click rate | Avg. click-to-open rate |
| All industries (overall benchmark) | 76% | 9% | 10% |
| Legal | 86% | 10% | 10% |
| Real Estate | 86% | 10% | 9% |
| Insurance | 84% | 13% | 12% |
| Not-for-Profit | 77% | 13% | 13% |
| Technology | 73% | 9% | 10% |
| Logistics and Supply Chain | 67% | 10% | 12% |
| Airlines/Aviation | 65% | 7% | 10% |
| Transportation and Trucking | 63% | 7% | 8% |
Audience size matters as much as industry. Recipient lists of 50 or fewer average an 89% open rate, while lists of more than 10,000 average 73%, because smaller sends are easier to target and feel more relevant to the people receiving them. For large organizations, the answer is usually to segment more deliberately, not to send less.
How Internal Email Tracking Works in Outlook
Outlook offers a couple of ways to gauge engagement natively, but neither one gives you a full picture. ContactMonkey fills in the rest, directly inside the same inbox you’re already using.
Can I track open rates for internal emails sent through Outlook?
To a limited degree. Outlook has a read receipt feature, but it depends on each recipient manually agreeing to send one, so it’s limited. Microsoft Viva Insights adds some data too, but it’s focused on individual productivity, not campaign-level metrics like open rate, click rate, or read time across a full distribution list.
That’s what ContactMonkey’s advanced email analytics for Outlook is built to solve. It works directly inside your existing inbox, no separate tool, no exporting data anywhere else, and gives you open rate, click rate, read time, and device type for every send. You get real internal communications metrics without changing how you actually work.
Is there a way to see who read my internal email?
With ContactMonkey, yes. Individual-level tracking (when enabled) shows exactly which employees opened an email, clicked a link, and how long they spent reading it, not just an aggregate percentage. That’s useful anywhere the stakes are specific to a person rather than the group as a whole, like knowing exactly who hasn’t opened a policy acknowledgment or a safety alert that needs everyone’s eyes on it before a deadline.
If individual-level detail isn’t the right fit for your organization’s privacy policy, anonymous tracking gives you the same open rate, click rate, and read time data in aggregate, without tying any of it to a specific employee. Either way, the reporting sits in the same dashboard you’d use for every other campaign, so email tracking for internal communications is easy.
How to Measure Internal Communications Effectiveness: A Step-by-Step Workflow
How to measure internal communications effectiveness comes down to four steps, run consistently, every time you send something that matters.
| Step | What you do | Why it matters | Where ContactMonkey helps |
| 1. Baseline | Pull your last 3 to 5 sends of the same type (e.g. weekly newsletter, policy update) and record open rate, CTR, CTOR, and read time for each | You can’t tell if a number is good or bad without knowing what “normal” looks like for your organization | Reporting tool compares multiple campaigns side by side automatically |
| 2. Segment | Break that same data down by department, location, or role | A healthy average can hide one team that’s disengaged entirely | Segmented Email Stats filters any campaign by role, location, or department |
| 3. Trend | Track the same 3 to 4 KPIs across every send of that type for at least a month | One send tells you almost nothing. A pattern across several tells you what’s actually working | Saved, shareable reports track performance over time without rebuilding the comparison each month |
| 4. Act | Change one variable at a time (subject line, send time, CTA placement) based on what the trend shows, then re-measure | Changing five things at once means you’ll never know which one actually moved the number | Click maps and link engagement data show exactly which part of the email to adjust first |
A few things worth being specific about at each step:
- Baseline first, always. A single email measured in isolation is just a number with no context. Even three past sends of the same type gives you something real to compare against.
- Segment before you conclude anything. A 65% open rate might be a strong result for a distributed frontline workforce and a mediocre one for a desk-based team of 50. Don’t decide whether a number is good until you’ve looked at who’s actually inside it.
- Trend over individual sends. One low-performing email doesn’t mean your strategy is broken. A downward trend across six sends in a row does. This is also where GSIC 2026‘s finding that 40% of communicators struggle to track and measure communications usually shows up. Teams are looking at single emails in isolation instead of a trend line, because nothing’s set up to make the comparison easy.
- Act on one variable, and give it time. Change your send time, subject line format, and CTA placement all in the same week, and you’ll end up with a better-performing email and no idea why. Pick one lever, run it for a few sends, then move to the next.

What Metrics Should You Use to Measure Internal Communications Effectiveness?
What metrics should I use to measure internal communications effectiveness? The honest answer is that it depends on what a specific email is trying to do. Not every send has the same job, so not every send needs the same internal email KPIs. The fastest way to answer this for any given email is to start with its goal, then pull only the internal communication email metrics that actually match it.
If the goal is awareness:
Anything beyond confirming the message reached people and registered is extra credit. A company-wide announcement doesn’t need a CTR goal if there was never a call to action in the first place.
- Delivery rate
- Open rate (directional only)
- Read time, as a rough proxy for whether it got more than a glance
- Device split, to confirm the format actually worked for how people were reading it
Getting the format and timing right in the first place also matters here, which is where internal communication best practices come in.
If the goal is understanding:
Open rate says the email was seen. It says nothing about whether anyone understood what changed, which is why a policy update or benefits announcement living or dying on open rate alone is a common mistake.
- Read time, specifically the “read” band (more than 9 seconds), not just opens
- A one-tap “was this clear?” micro-pulse embedded in the email itself
- Clicks through to a linked FAQ or help doc, which often signals confusion rather than interest
If the goal is action:
This is the category where open rate matters least. Someone can open an email, read it, and still never click through and complete the action.
- Click rate and click-to-open rate
- Clicks on the primary CTA specifically, not just any link in the email
- Completion of whatever the CTA asked for (a form submitted, a session registered for, a policy acknowledged)
- How engagement shifts after a reminder send, which tells you whether the first email actually worked or just delayed the problem
If the goal is feedback:
A high response rate on a pulse survey means little if nobody’s reading what came back. This is the category most likely to get measured by volume alone and never actually acted on, which is also where GSIC 2026 found the widest gap: 95% of organizations collect feedback, but only 15% consistently close the loop on what they did with it.
- Survey or pulse response rate
- Comment volume on embedded feedback tools
- The actual themes coming back in responses, not just the count of how many people replied
Picking internal email KPIs this way also solves the problem from earlier in this guide, tracking every metric on every send.
How ContactMonkey Helps You Track Internal Email Metrics
Everything in this guide is easier with the right tooling behind it. Here’s what that actually looks like inside ContactMonkey, one of the top internal communications platforms built specifically for this kind of measurement.
Get a real-time view of your internal email analytics
Every send generates open rate, click rate, click-to-open rate, device split, and read time automatically, all visible the moment your email lands. You’re not pulling together numbers from Outlook, a separate survey tool, and a spreadsheet someone updates manually. Your internal communications analytics and reporting live in one place, with a real-time dashboard built specifically for internal communicators.
Turn your metrics into a number leadership actually responds to
Internal communicators increasingly believe their work contributes directly to business outcomes, but proving that to leadership is a different problem entirely. Executives think in revenue and cost. A 76% open rate doesn’t automatically translate into either one, and when it can’t be translated, IC’s seat at the table gets harder to hold onto.
This is what ContactMonkey’s ROI Calculator is built for. It takes numbers you already have, emails sent per month, hours spent creating each one, and current engagement rates, and converts them into hours saved, dollars saved, and engagement potential left on the table. When your ROI is backed by your own campaign data, it’s much easier for leadership to see the impact of your internal comms.
Compare performance across departments, locations, and roles
ContactMonkey’s audience segmentation lets you filter any campaign by department, location, or job title, so you can see the email stats for each employee segment instead of one blended, company-wide average. You can see that one region’s click rate is half of everyone else’s, or that a specific department consistently skims instead of reads, and adjust that group’s content or format without guessing.
Create and design faster with CoAuthor
Slow email creation is often the reason measurement gets skipped altogether. There’s no time left to review what happened once a send is out the door. CoAuthor, ContactMonkey’s AI email content generator, turns a rough idea into a formatted, on-brand email in seconds, so iterating on what your data tells you (a new subject line, a restructured layout, a different CTA placement) doesn’t eat up the rest of your day. You can try CoAuthor free with three emails, no strings attached, and find ready-made prompts in the AI prompt library.

Ask your data a question with Insights Assistant
Most reporting workflows still run through an export-to-Excel chain: pull the data, drop it into a spreadsheet, build a chart, then explain what it means. Insights Assistant replaces that entirely. It lets you ask plain-language questions about your campaign data, like which department’s click rate dropped last month, or how this quarter’s read time compares to last, and get an immediate answer back, including a visualization. It’s the fastest way to turn the internal email KPIs in this guide into an actual answer you can show leadership.
Why Internal Communications Teams Measure Success With ContactMonkey
Getting this right comes down to tracking the metrics tied to what each email is actually trying to do, and having a consistent process for turning those numbers into changes. That’s the difference between a communicator who can report an open rate and one who can explain why engagement moved and what they’re doing about it.
Most teams already have the instinct to measure. What’s usually missing is the right internal communications platform and a simple process that makes measurement part of everyday work. ContactMonkey brings the internal communications metrics, segmentation, and reporting covered throughout this guide into one place, alongside the tools that make it faster to act on what you find, from CoAuthor to Insights Assistant.
If you’re ready to see what your own internal email metrics actually look like with this in place, book a demo today.
Frequently Asked Questions About Internal Email Metrics
What metrics should I use to measure internal communications effectiveness?
The right metric depends on the email’s goal. For awareness, prioritize delivery rate, open rate, and device split. For understanding, prioritize read time and a quick “was this clear?” pulse. For action, prioritize click-through rate and CTA completion. For feedback, prioritize survey response rate and the actual themes coming back in responses. Tracking every internal communications metric on every send usually means tracking the wrong things for most of them.
Can I track open rates for internal emails sent through Outlook?
Only to a limited degree using Outlook’s native features. Outlook’s read receipt function depends on each recipient manually agreeing to send one, and Microsoft Viva Insights is built around individual productivity rather than campaign-level metrics like open rate or click rate across a full distribution list. A dedicated internal email platform like ContactMonkey adds open rate, click rate, read time, and device data directly inside Outlook, without requiring any action from the recipient.
Is there a way to see who read my internal email?
Yes, with the right internal email platform. Individual-level tracking shows exactly which employees opened an email, clicked a link, and how long they spent reading it, useful for anything time-sensitive like a compliance deadline or safety alert. Anonymous tracking is also available for organizations that want aggregate data (open rate, click rate, read time) without attaching any of it to a specific person.
How do internal email tracking and reporting tools compare?
Internal email tracking tools fall into three categories, each with a different level of depth. Native inbox tools like Outlook and Gmail offer little beyond delivery confirmation and unreliable read receipts. Marketing email platforms report opens and clicks but are built for external lists, not employee audiences or sending from Outlook. Dedicated internal communications platforms like ContactMonkey are purpose-built for internal email, with internal communications KPIs, audience segmentation, and read time tracking built in, all inside the Outlook or Gmail inbox communicators already use.
How do I prove internal communications ROI to leadership?
Proving internal communications ROI means translating engagement metrics into the terms leadership already thinks in: hours saved, dollars saved, and engagement gained. A strong open rate on its own doesn’t demonstrate business impact to an executive audience focused on revenue and cost. Tools like ContactMonkey’s ROI Calculator convert send volume, time spent per email, and engagement rate directly into that language.
What is a good internal communications metric to report to leadership?
Leadership responds best to metrics tied to outcomes, not just activity. Pair an engagement number such as open rate or click rate with a business outcome, for example hours saved on manual email production or the share of employees who completed a required action. ContactMonkey’s ROI Calculator converts engagement data into hours saved and dollars saved for exactly this purpose.