You sent the campaign. The report is open. The open rate is 38%, and somewhere in that data is the thing that would tell you whether the timing was right, whether this audience responds differently than the last one, and what you should change next time.
But getting to that answer means navigating between screens, applying filters manually, and doing the interpretive work yourself.
Most days you do not have the twenty minutes it takes to get there. So you note the headline number, close the tab, and move on.
ContactMonkey is changing this!
Ask Your Campaign Data a Question
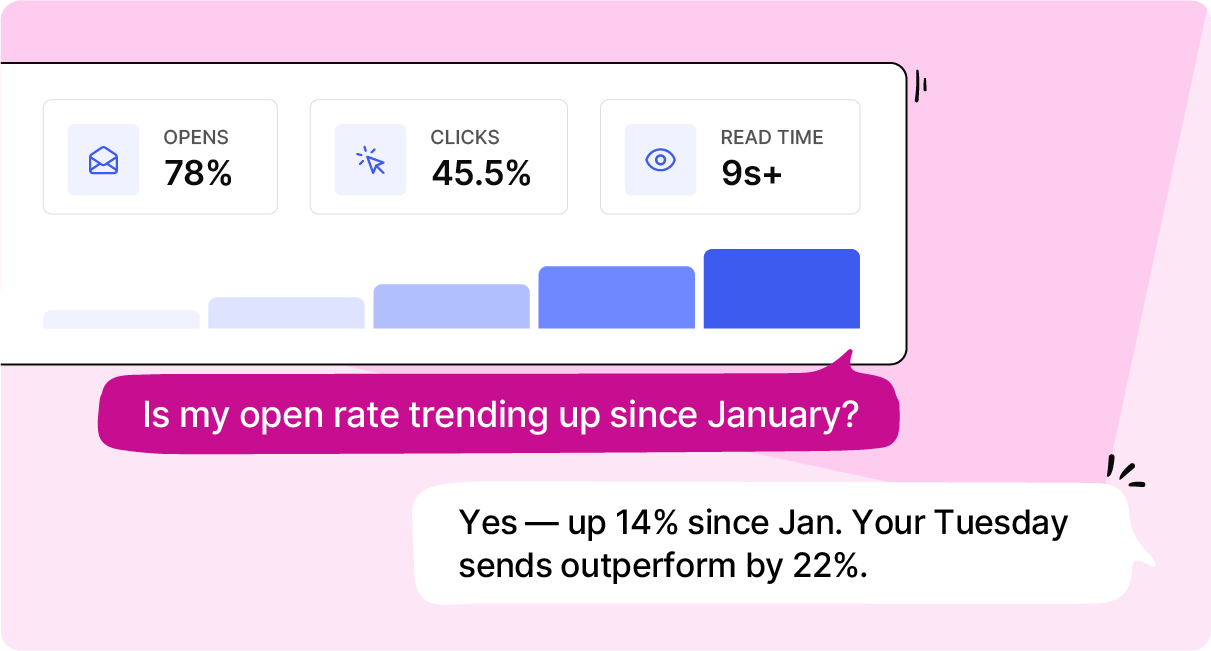
We just launched a chat panel embedded in the workflow. You type a question in plain language and get a direct answer in seconds, with a one-line interpretation of what it means and a chart when the data warrants one.
Questions like:
- “How did this campaign compare to my last three sends?”
- “Which subject line drove the most clicks this month?”
- “Is my open rate trending up or down since January?”
- “Show me everything tagged executive communications from the last quarter.”
No filtered table to read through or any raw metrics to benchmark in your head. An answer, in context, without leaving the screen you are already on.
Compare Performance Without the Spreadsheet
Once you’ve found the metrics you care about, the real work is putting them in context:
- Compared to what?
- Is this campaign outperforming your last few sends, or just landing in your usual range?
- Are clicks trending up month over month, or did one outlier skew the story?
- And which audience, tag, or mailbox is actually driving the change?
With the new chat panel, you can ask for those comparisons in plain language (across recent campaigns, over a timeframe, or within a specific slice) and get a clear takeaway right where you’re already reviewing performance.
When the story is easier to see as a trendline, you’ll also get a chart to match.
From Insight to Report in One Click
When a question turns up something worth sharing, you should not have to rebuild the query from scratch in the Reports page.
Any answer the panel surfaces can become a saved, shareable report in a single click.
This Is What Better Analytics Looks Like for Internal Comms
The numbers have always been in ContactMonkey. The interpretation, the comparison, the anomaly you would have missed: those are what take time.
This closes that gap.
Interested in learning more? Book a demo, and we will walk you through it.