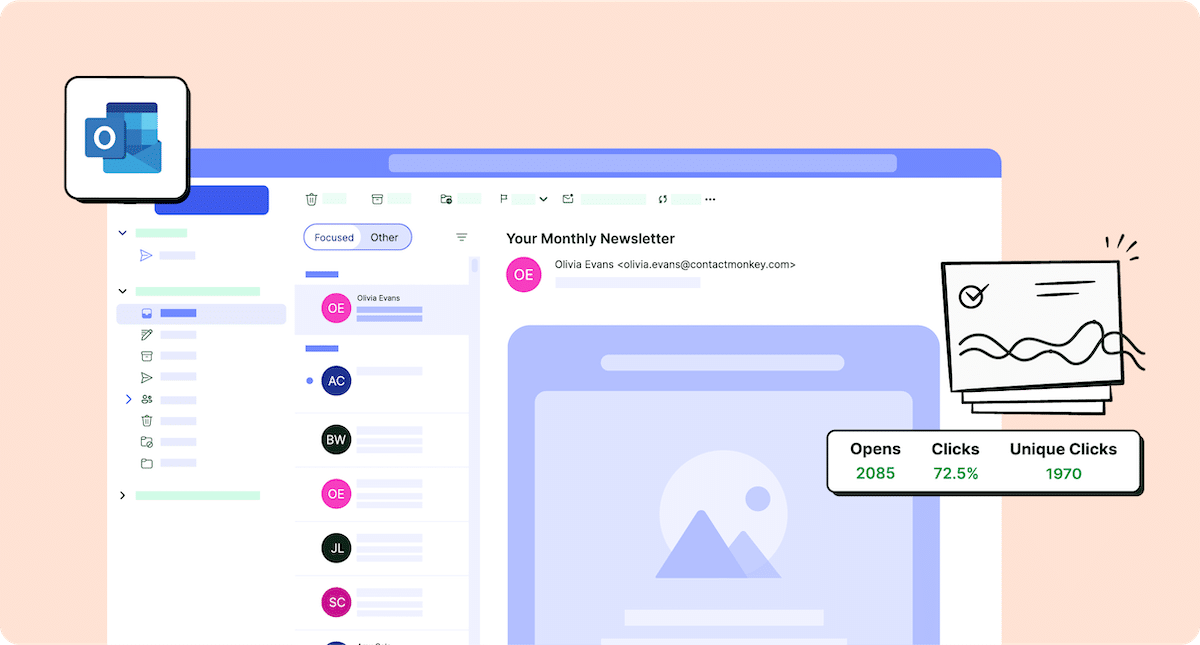
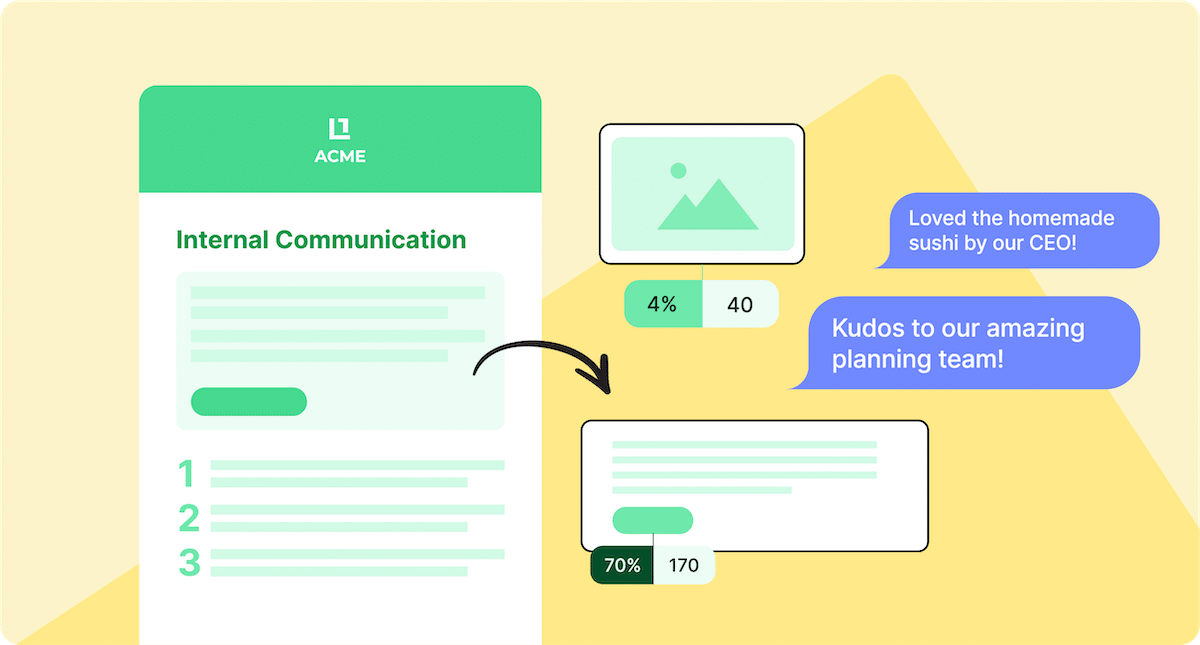
If you’re sending internal emails every week but can’t tell if your performance is “good,” you’re not alone. This article helps you add context to your analytics and enables smarter decisions.
Many internal communications (IC) teams operate in the dark, tracking open rates or click-through rates (CTR) in isolation without any real sense of whether those numbers are above, below, or on par with other organizations.
The truth is, data means little without context. And that’s where benchmarking comes in.
In this guide, we’ll break down what internal email benchmarks are, how your organization stacks up against 2025 industry standards, and how to use analytics tools to improve your results.
Take a self-guided tour of ContactMonkey
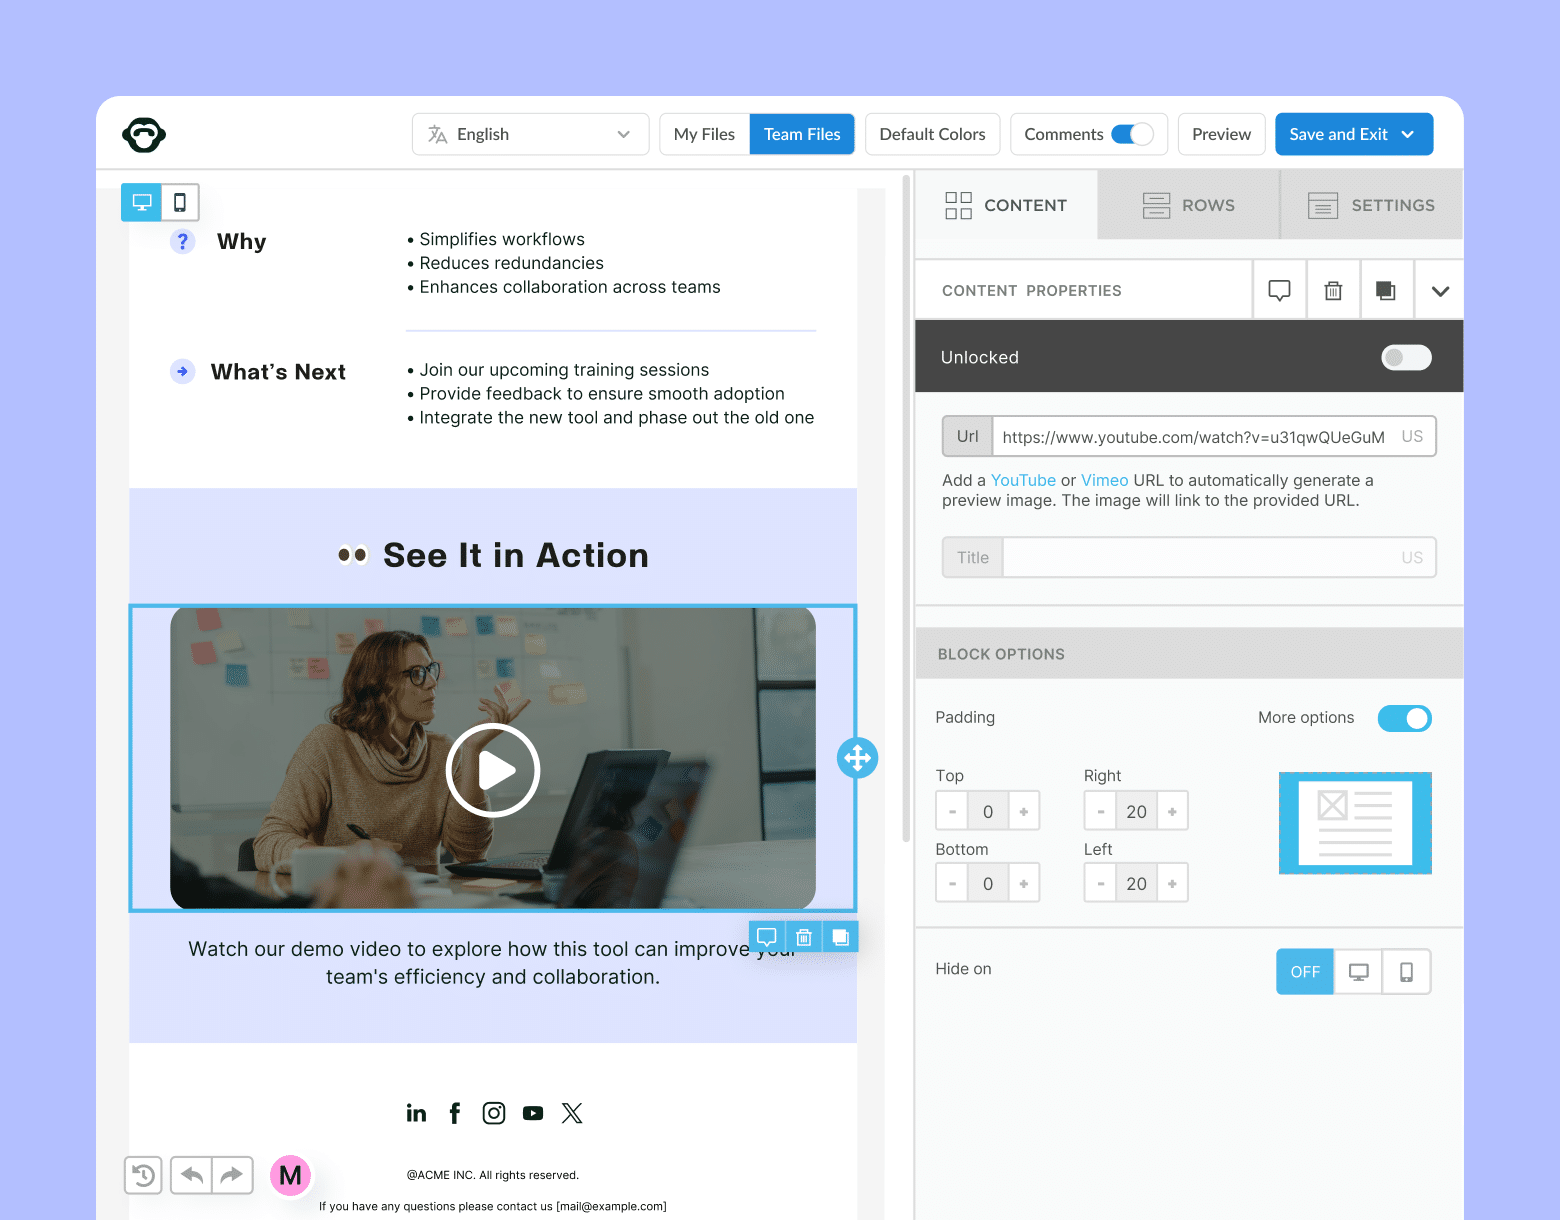
See how our key features can streamline your internal communications.
Take product tour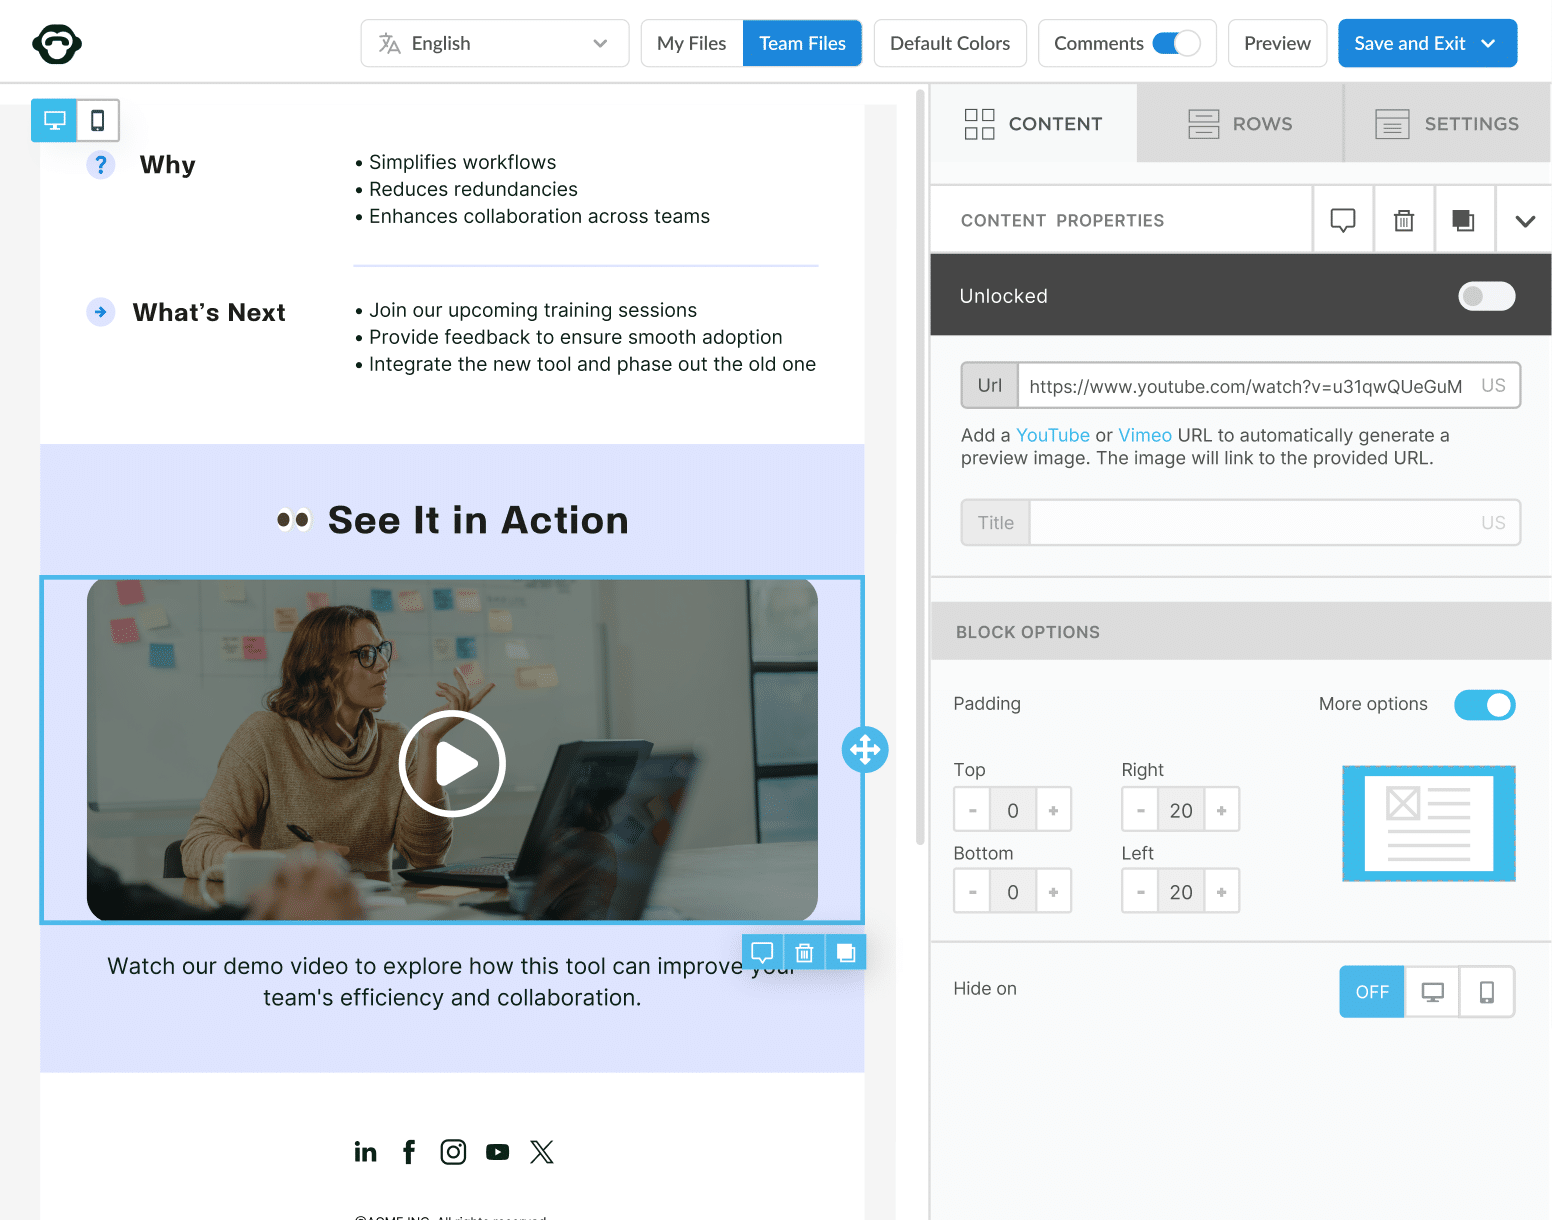
What Are Internal Email Metrics and Why They Matter
Internal email metrics are the heartbeat of employee communication performance. They tell you whether your messages are being opened, read, and acted upon. But more importantly, they reveal how effectively your content is connecting employees to your organization’s goals.
The core metrics every communicator should track
1. Open rate: The percentage of employees who opened your email. It shows whether your subject line, timing, and sender name captured attention.
2. Click-through rate (CTR): The number of employees who clicked on at least one link in your message. CTR measures how engaging your content and CTAs are.
3. Read time: How long employees spend reading your email, an indicator of depth of engagement. A higher read time suggests relevance and clarity.
4. Survey responses: Pulse survey participation rates measure how willing employees are to share feedback, one of the clearest signals of trust and engagement.
5. Device engagement: Understanding whether employees engage via desktop or mobile helps you optimize formatting and readability.
These metrics don’t just quantify communication, they qualify its impact. High open rates without clicks may indicate curiosity but not connection. High read time with low survey participation may suggest passive consumption rather than active engagement.
By consistently tracking these metrics, you’re not just measuring performance, you’re uncovering patterns in employee behaviour that can shape stronger, data-driven communication strategies.
The Latest 2025 Internal Email Benchmarks
According to ContactMonkey’s 2025 Internal Email Benchmark Report, data across thousands of internal email campaigns revealed clear patterns in employee engagement across industries and organization sizes.
Here’s what the latest numbers tell us:
Average internal email open rates
Across all industries, the average internal email open rate in 2025 is 67%, a slight increase from 65% in 2024.
- Best-in-class organizations: 75–80% open rates
- Average performers: 55–70% open rates
- Below average: Anything under 55%
Public sector and healthcare organizations consistently led the pack, both averaging above 70%, while manufacturing and technology sectors tended to hover closer to 60–65%.
High open rates typically indicate effective subject lines, strong sender trust, and clear content relevance.
Average internal email click-through rates (CTR)
The average CTR in 2025 is 13%, up from 12% in 2024.
High-performing internal communications teams achieved 15–18% CTRs by using interactive content, embedded videos, and clear CTAs.
If your CTR is below 10%, it might signal one of three issues:
- Your email content isn’t offering enough actionable value.
- Links are buried or unclear.
- Employees are consuming content passively instead of interacting.
Average read times
Read times provide context beyond opens and clicks. The 2025 Benchmark Report shows:
- Average read time: 13 seconds
- High performers: 16–18 seconds
- Low performers: 8–10 seconds
Longer read times aren’t always better; concise, relevant messages can outperform lengthy newsletters. The key is alignment. Your read times should match your content type and purpose.
Average survey response rates
Internal communicators increasingly embed pulse surveys in newsletters. In 2025, the average email survey response rate is 38%, with top organizations achieving 45% or more.
Strong participation signals not just engagement but trust as employees believe their feedback will be seen and acted upon.
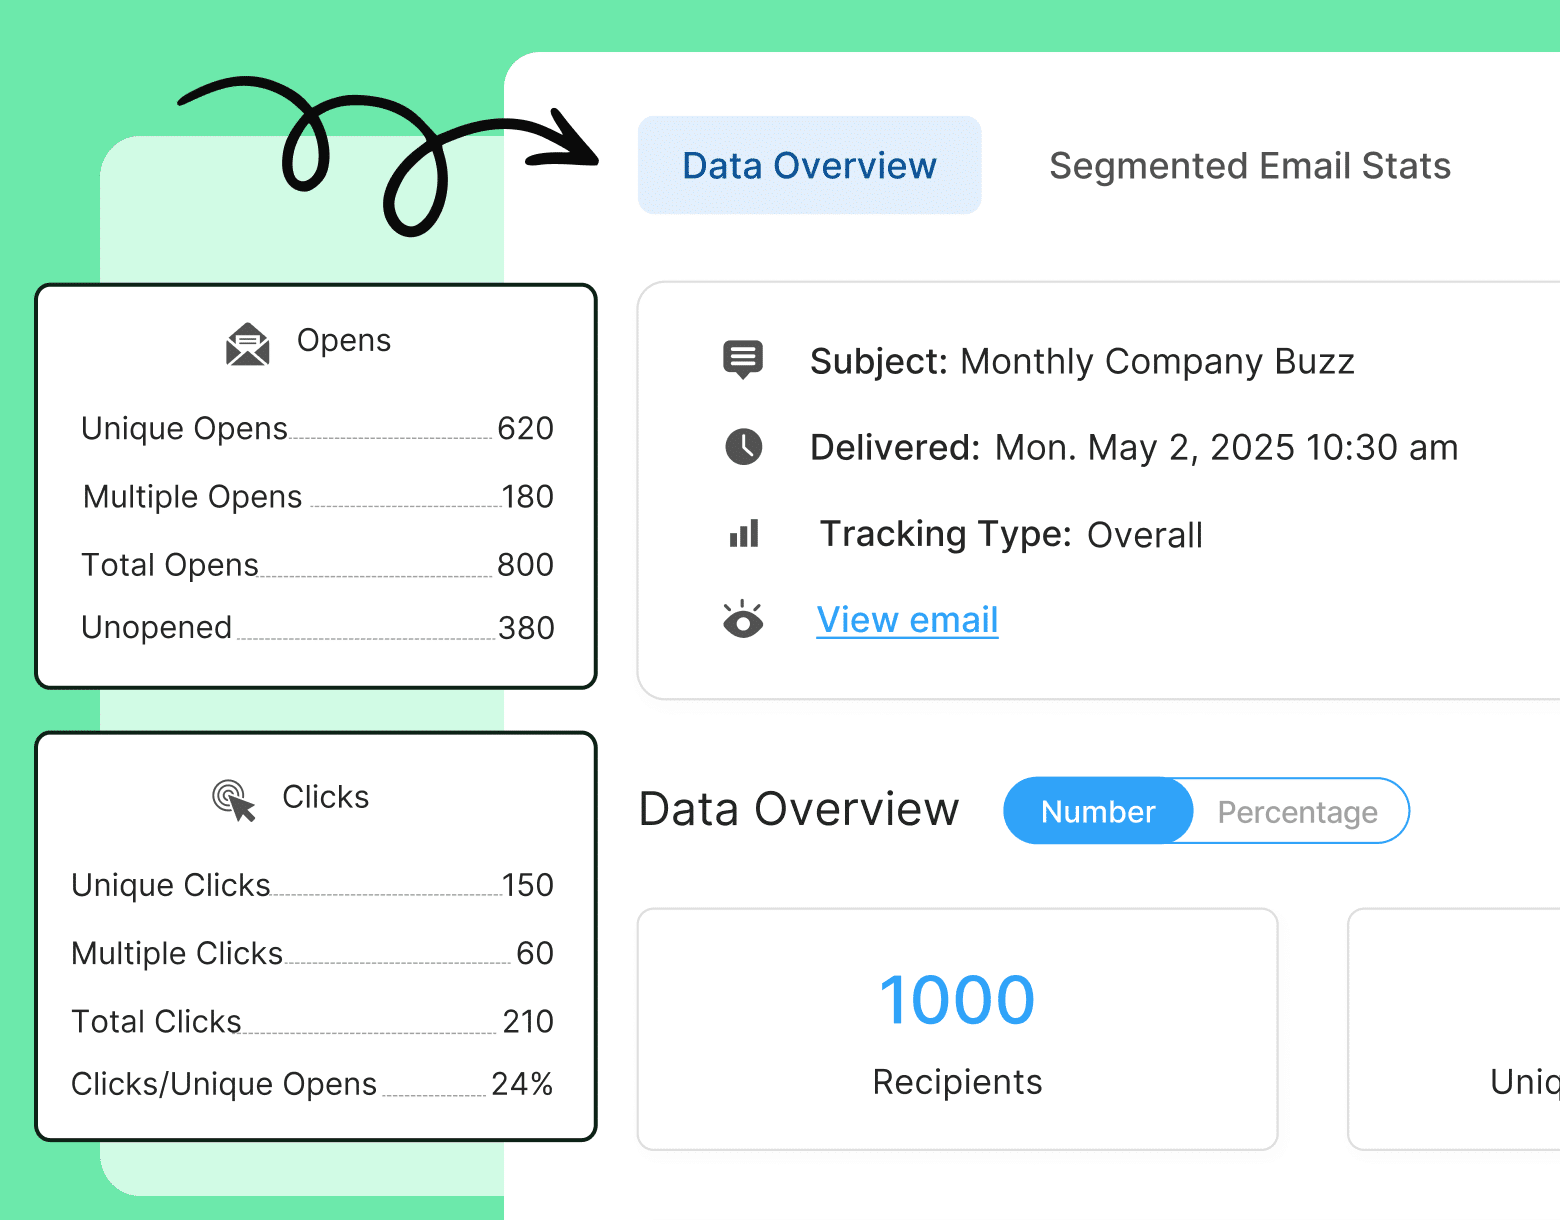
Get powerful email analytics and reporting features
Know exactly who is opening and engaging with your employee communications and company newsletters.
Explore analytics & reporting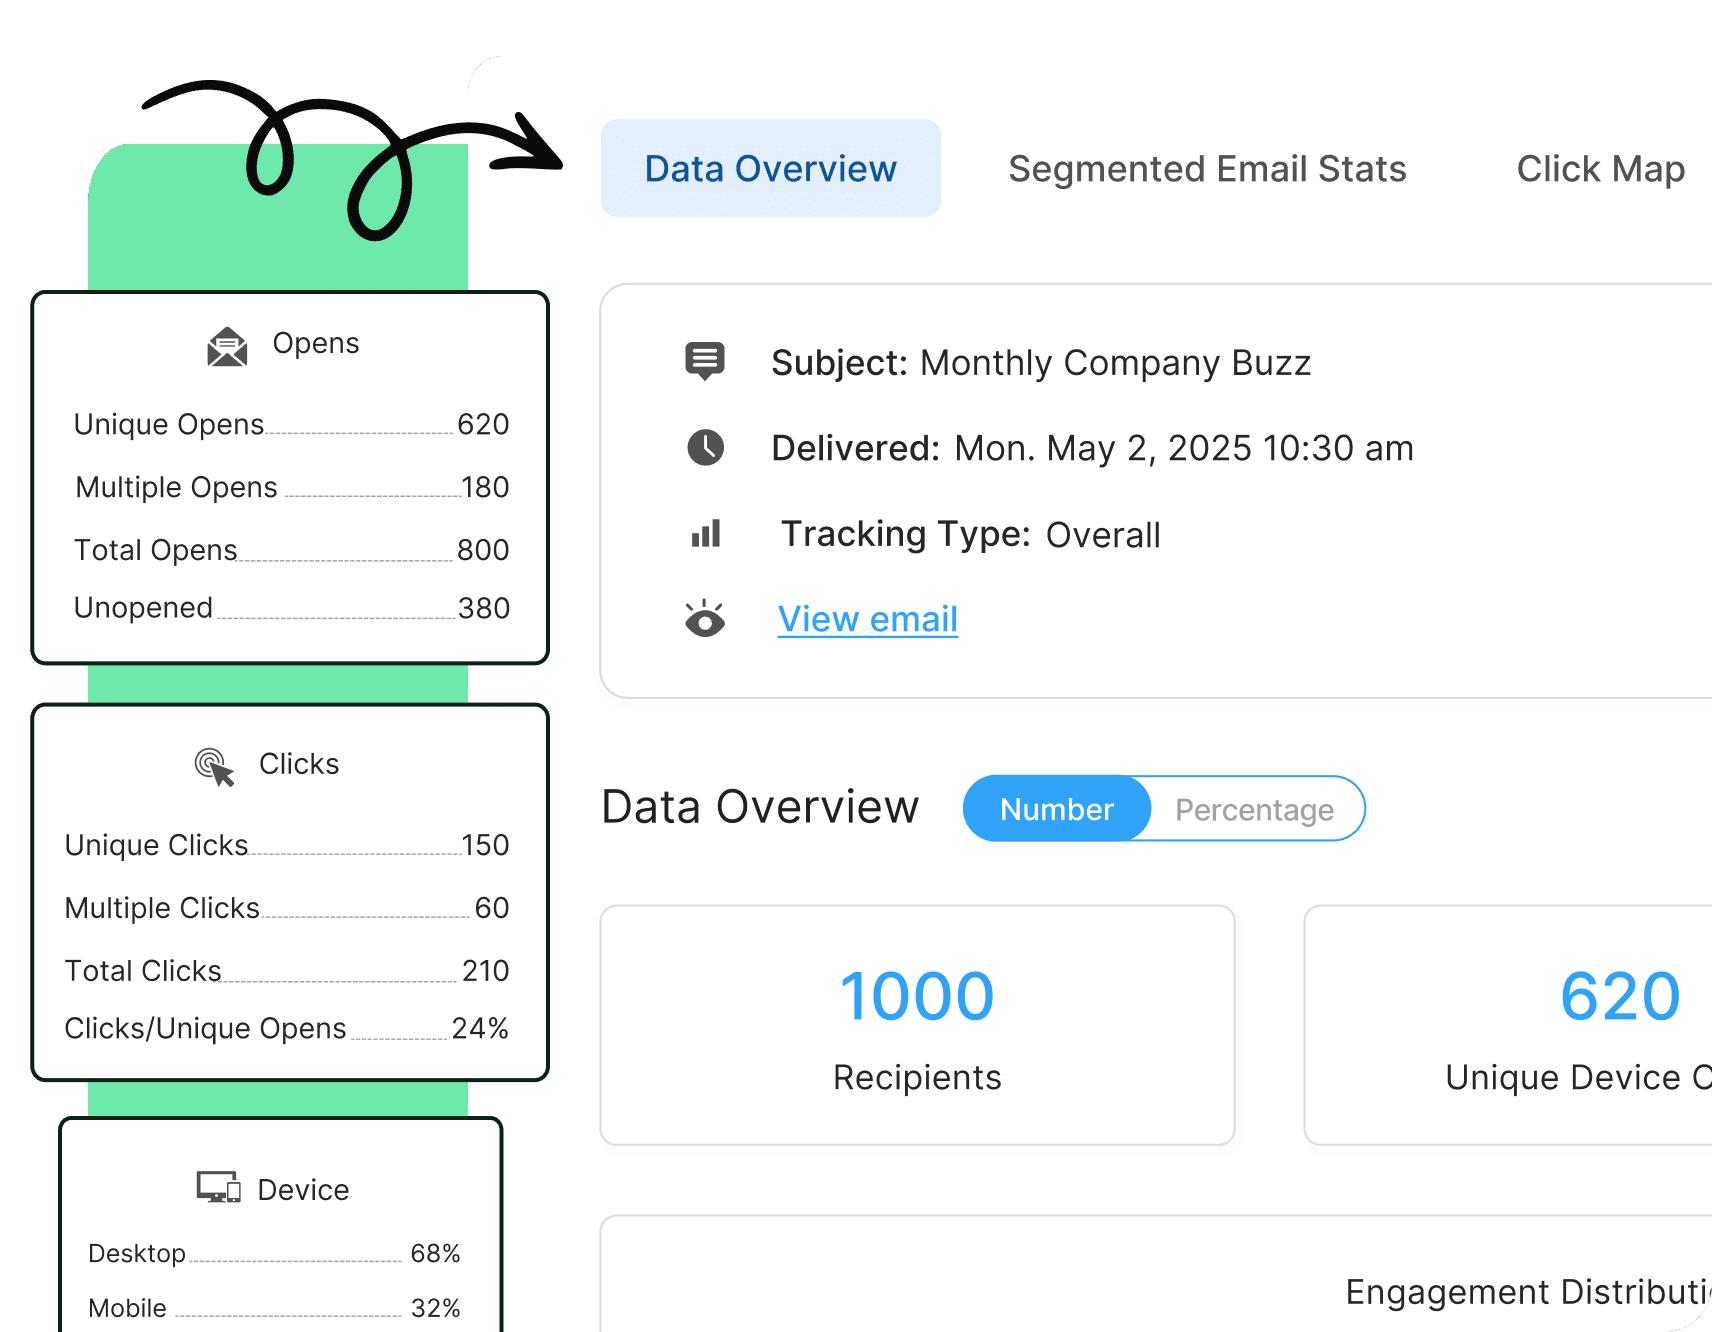
How to Benchmark Your Own Internal Emails
Knowing the industry averages is only half the battle. The real value comes from comparing your results against these benchmarks and identifying where to improve.
Here’s a simple framework you can follow:
1. Define your goals and KPIs
Every internal email should ladder up to a specific objective: awareness, action, or alignment.
Define what success looks like for each message:
- Awareness campaigns → prioritize open rates
- Engagement campaigns → prioritize CTR and read time
- Feedback campaigns → prioritize survey responses
Setting KPIs by campaign type ensures your benchmarks are meaningful.
2. Collect your data consistently
Without reliable data, benchmarking is guesswork.
Relying on Outlook or Gmail alone makes this nearly impossible, as they don’t provide metrics like read time or department-level segmentation.
Using a tool like ContactMonkey’s analytics dashboard, you can automatically track:
- Open and click rates by department, location, or sender
- Read times across audiences
- Device engagement (desktop vs. mobile)
- Survey participation directly in the email
Consistency is key. Collect data the same way every time to ensure accuracy.
3. Compare against industry benchmarks
Now, measure your internal email performance against 2025 standards:
| Metric | 2025 Average | High Performers | Your Benchmark Target |
| Open Rate | 67% | 75–80% | Aim for +5–10 pts above your current average |
| CTR | 13% | 15–18% | Improve by +2–3 pts per quarter |
| Read Time | 13 sec | 16–18 sec | Optimize for relevance, not length |
| Survey Response | 38% | 45%+ | Target +5% growth YoY |
If you’re significantly below average, it’s not a red flag. It’s an opportunity to uncover what’s working elsewhere and replicate success.
Unlock Internal Comms Superpowers
Discover why 10,000+ rely on us. See the internal email and employee newsletter platform in action.
Book demo

4. Identify performance gaps
Benchmarking isn’t about chasing arbitrary numbers, it’s about discovering insights.
Ask yourself:
- Are my open rates lagging? → Look at subject lines and send times.
- CTR low? → Revisit your CTAs or content hierarchy.
- Read times short? → Shorten text or add visuals.
- Survey responses low? → Simplify your survey questions.
By identifying trends across several campaigns, you’ll pinpoint patterns, not just anomalies.
Practical Tips to Improve Below-Benchmark Performance
Once you know where you stand, you can take action to move closer to best-in-class performance.
Optimize your send times
Timing matters. The 2025 Benchmark Report found that emails sent mid-week between 10 a.m. and 1 p.m. achieved the highest open rates.
If your audience is global, consider timezone sending to ensure employees receive messages during their local working hours.
Write better subject lines
Subject lines remain the top driver of open rates.
- Keep them short (5–7 words).
- Lead with value (“Your new benefits guide is here”).
- Avoid jargon and exclamation overload.
According to the report, personalized subject lines boost open rates by 15% compared to generic ones.
Segment your audience
Not every employee needs every email. Segmenting your sends by department, location, or role helps you deliver relevant information, and it shows in your data.
The 2025 Benchmark Report found segmented emails drive 22% higher read times and 18% higher CTRs compared to all-company sends.
With ContactMonkey’s list management feature, you can target multiple employee groups at once (up to ten lists per campaign), ensuring precision without manual work.
Personalize your content
Go beyond “Hi [First Name].” Personalization means tailoring the message to employees’ roles or interests.
For example:
- HR updates customized by region
- IT notifications segmented by department
- CEO messages localized with employee stories
When employees feel seen, they engage more, and your metrics prove it.
A/B test your campaigns
Small changes make a measurable difference. A/B testing your subject lines, visuals, or CTAs helps you identify what truly resonates.
According to the Benchmark Report, A/B testing improved open rates by up to 24% in organizations that tested regularly.
Watch ContactMonkey LIVE in action
Join live demo
Tools That Make Benchmarking Easy
You can’t improve what you can’t measure, and you can’t measure what you can’t see.
Basic email clients like Outlook or Gmail weren’t built for analytics. They lack engagement metrics, read-time tracking, and list-level reporting. That’s where dedicated internal communications software comes in.
The limits of Outlook and Gmail
While they’re convenient for sending, they only track delivery and read receipts. Neither of which tell you much about engagement or comprehension.
Without analytics, communicators often rely on anecdotal feedback (“People liked the last newsletter”) rather than quantifiable data.
ContactMonkey’s analytics advantage
ContactMonkey integrates directly with Outlook and Gmail, turning your everyday email client into a powerful internal communications hub.
With real-time analytics dashboards, you can:
- Track open and click rates by department, location, or role.
- Measure read time, survey engagement, and device usage.
- Visualize trends across time to see what’s improving, and what’s not.
- Export your data into external dashboards like Power BI or Tableau for advanced analysis.
Real-world results: from blind to informed
Organizations featured in the 2025 Benchmark Report shared tangible gains after implementing analytics.
One example: a healthcare organization using ContactMonkey increased open rates from 58% to 78% within three months by optimizing subject lines, testing send times, and segmenting audiences.
Another enterprise team achieved a 20% lift in CTR simply by embedding pulse surveys and simplifying CTAs.
When communicators see what’s working, they can replicate it. When they see what’s not, they can adjust immediately.
Create internal emails that get opened and read
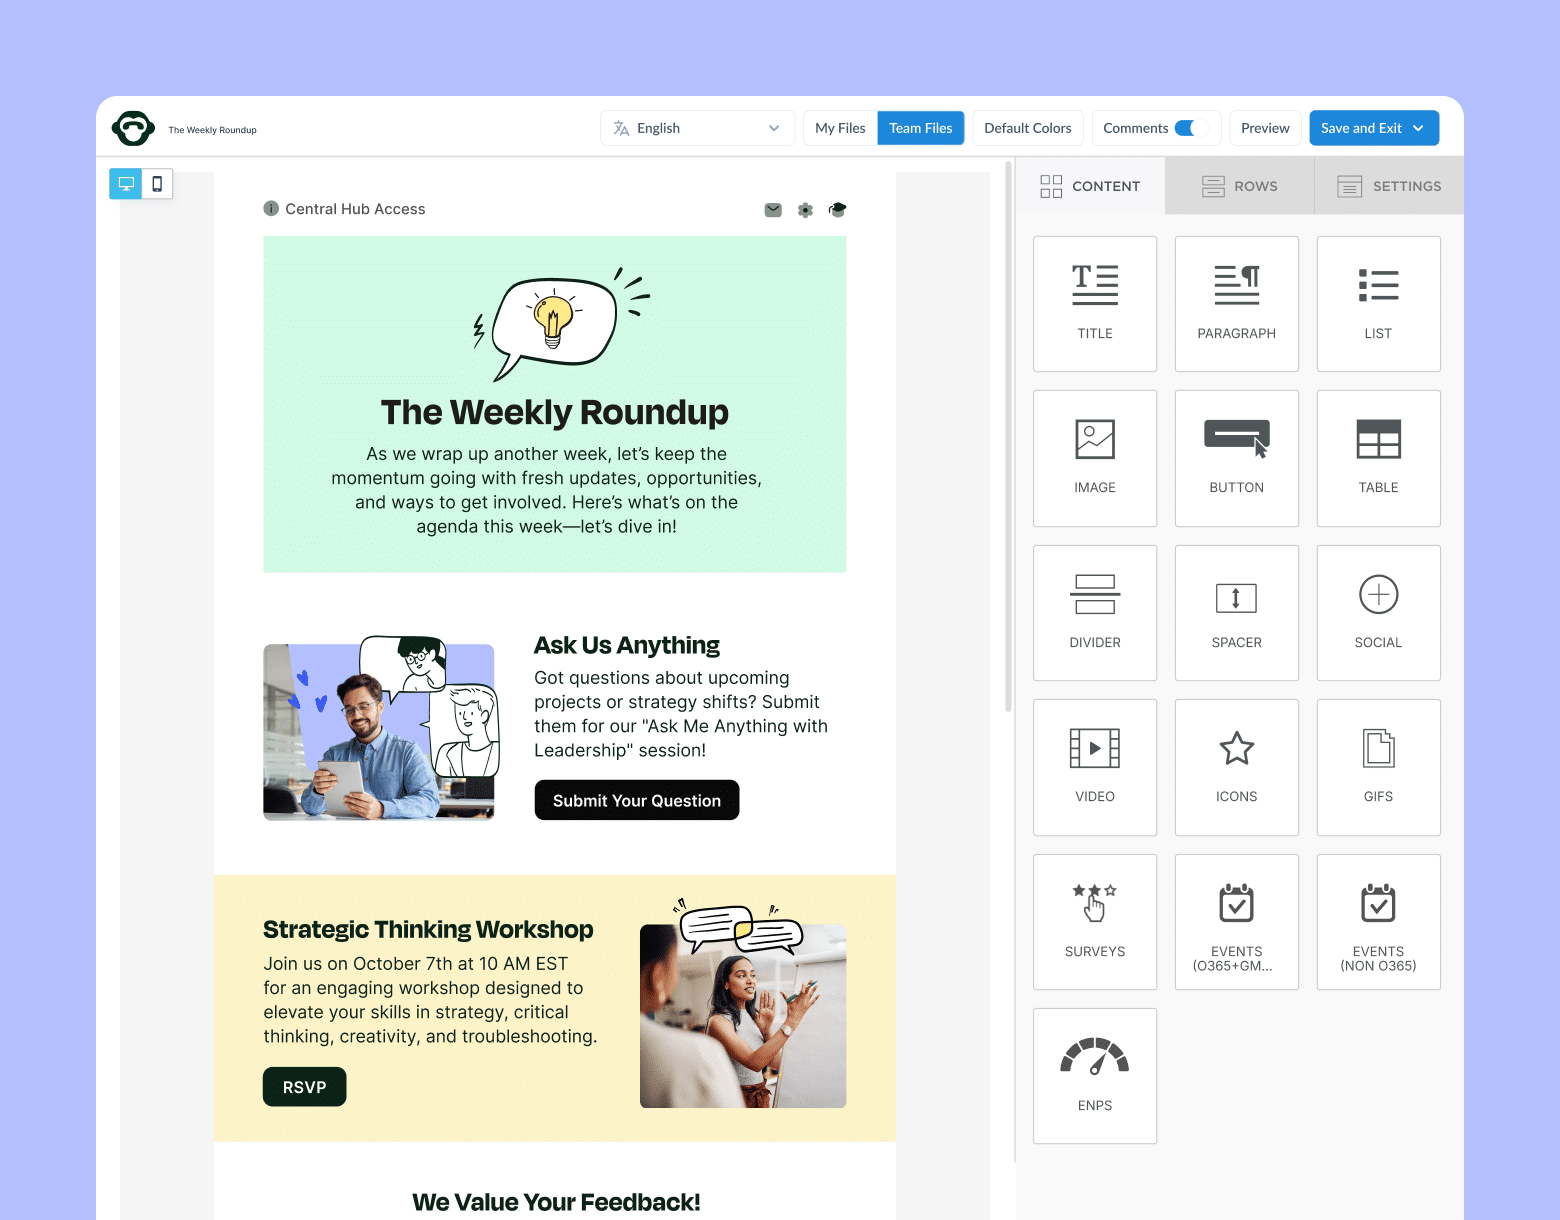
No design or technical expertise needed. Save time, increase engagement, and dazzle your employees with fun and interactive communications.
Explore email features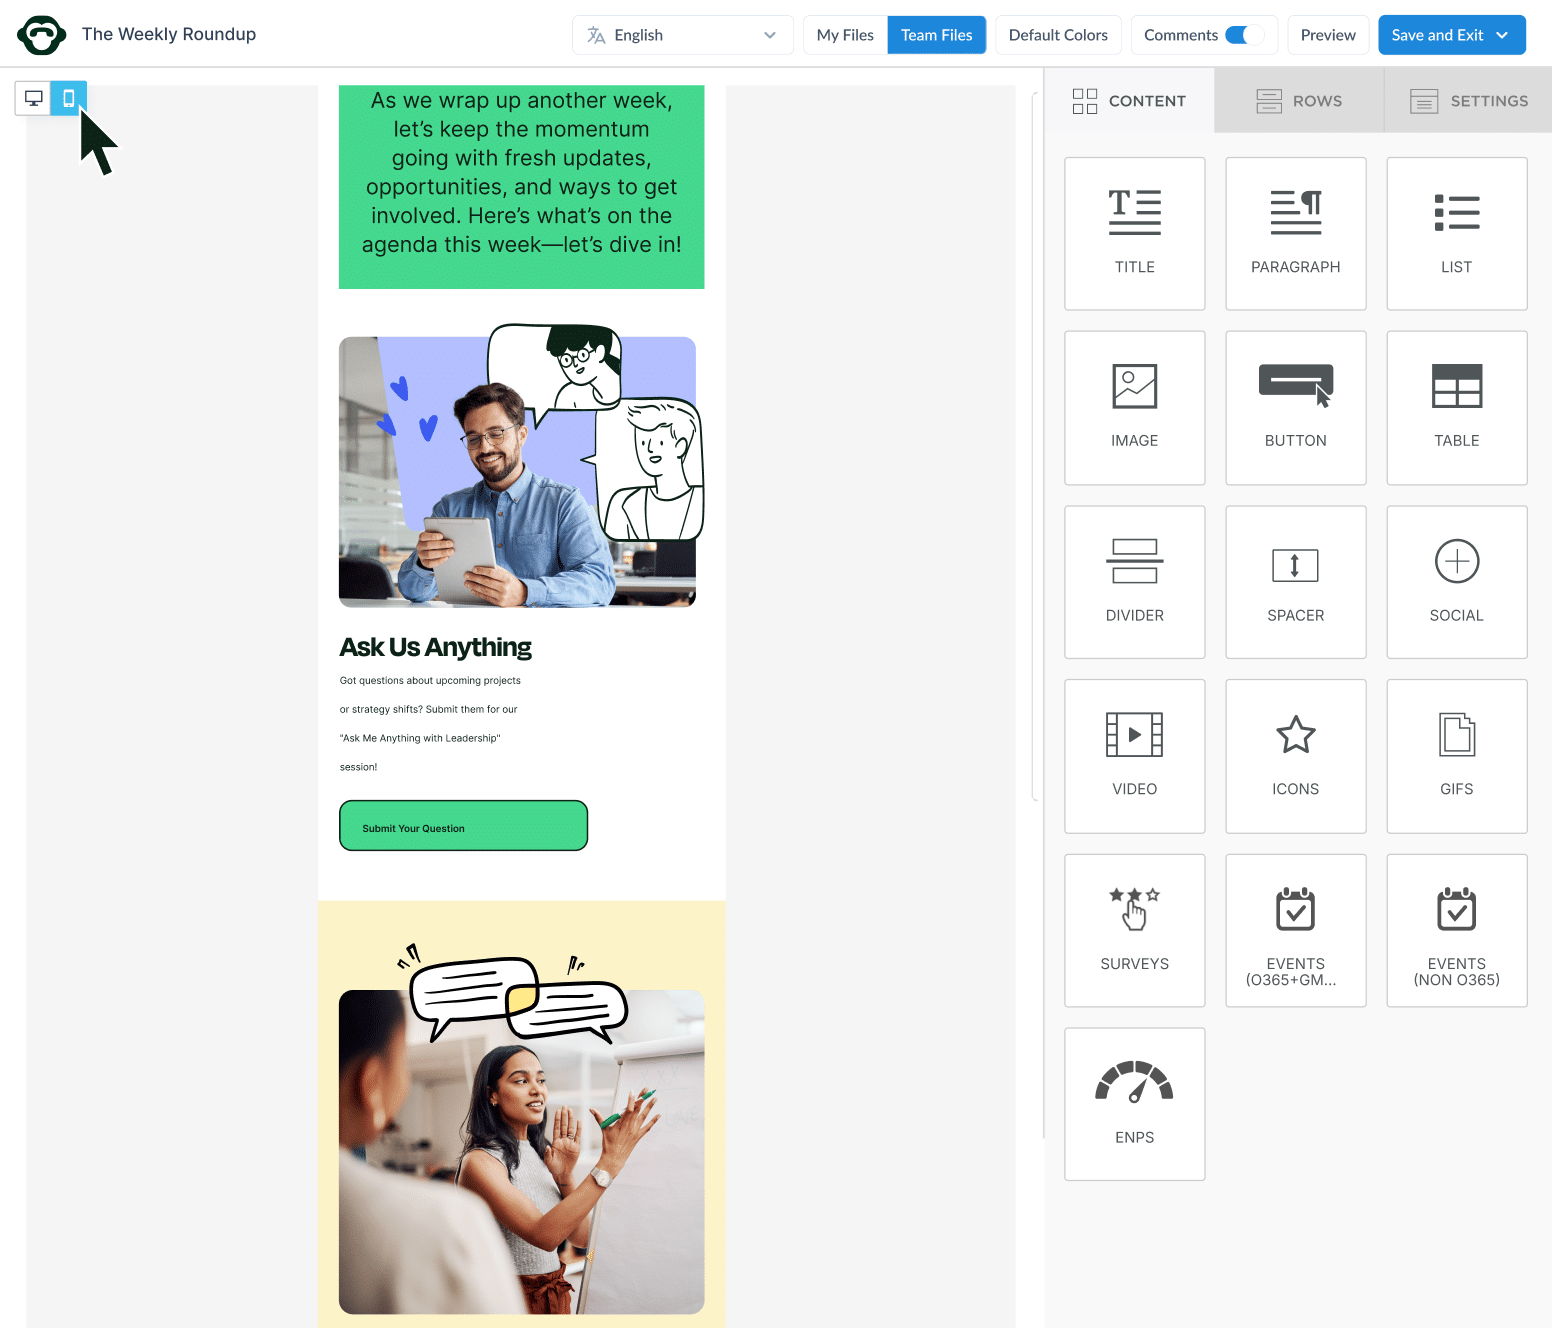
From Benchmarks to Business Impact
Benchmarking deals with building communications that move the needle on engagement, clarity, and trust.
When you combine benchmark data with real-time analytics, you create a feedback loop that continuously improves your internal communications.
With ContactMonkey, you can:
- Compare performance across campaigns, teams, and time periods.
- Identify what drives engagement and double down on it.
- Share measurable insights with leadership to prove ROI.
Because when you move from blind sending to data-informed communication, you’re not just improving emails, you’re shaping culture, alignment, and employee experience.
See How Your Internal Emails Measure Up
Benchmark your performance and turn insights into action with ContactMonkey’s real-time analytics dashboards, right inside Outlook and Gmail.
- Track key metrics: Though the analytics feature, measure open rates, click-throughs, and read times across every campaign.
- Benchmark with confidence: Compare your results against 2025 industry standards to see where you stand.
- Understand your audience: View engagement by department, role, or location for precision targeting.
Chat with one of our experts to understand how you’re performing today, what’s working well and what you do to improve your internal comms. Book a demo, today!
Frequently Asked Questions
What is the benchmark for internal email open rates?
The average internal email open rate in 2025 is 67%, with top-performing organizations reaching 75–80%. Anything below 55% suggests there’s room to improve timing, subject lines, or sender trust.
What is a good CTR for internal emails?
A strong click-through rate (CTR) for internal emails is around 13%, with best-in-class organizations achieving 15–18%.
How do you measure internal email effectiveness?
Track open rates, CTR, read time, and survey participation to gauge how well employees are engaging with your messages. Use analytics dashboards to visualize trends and identify where to improve.
Why should you benchmark internal email metrics?
Benchmarking provides context. It helps IC teams understand whether their results are average, above, or below industry standards, and highlights where to optimize.
What tools help benchmark internal emails?
Basic email clients provide limited insight. Tools like ContactMonkey offer in-depth analytics dashboards, segmentation, and A/B testing to make benchmarking easy and actionable.

