January has been a great start to the new year for the Product and Development team at ContactMonkey. Here’s a round-up of new features, improvements, and bug fixes ⚒️
Improvements in January 2020
Campaign Overview Page: Graph Update
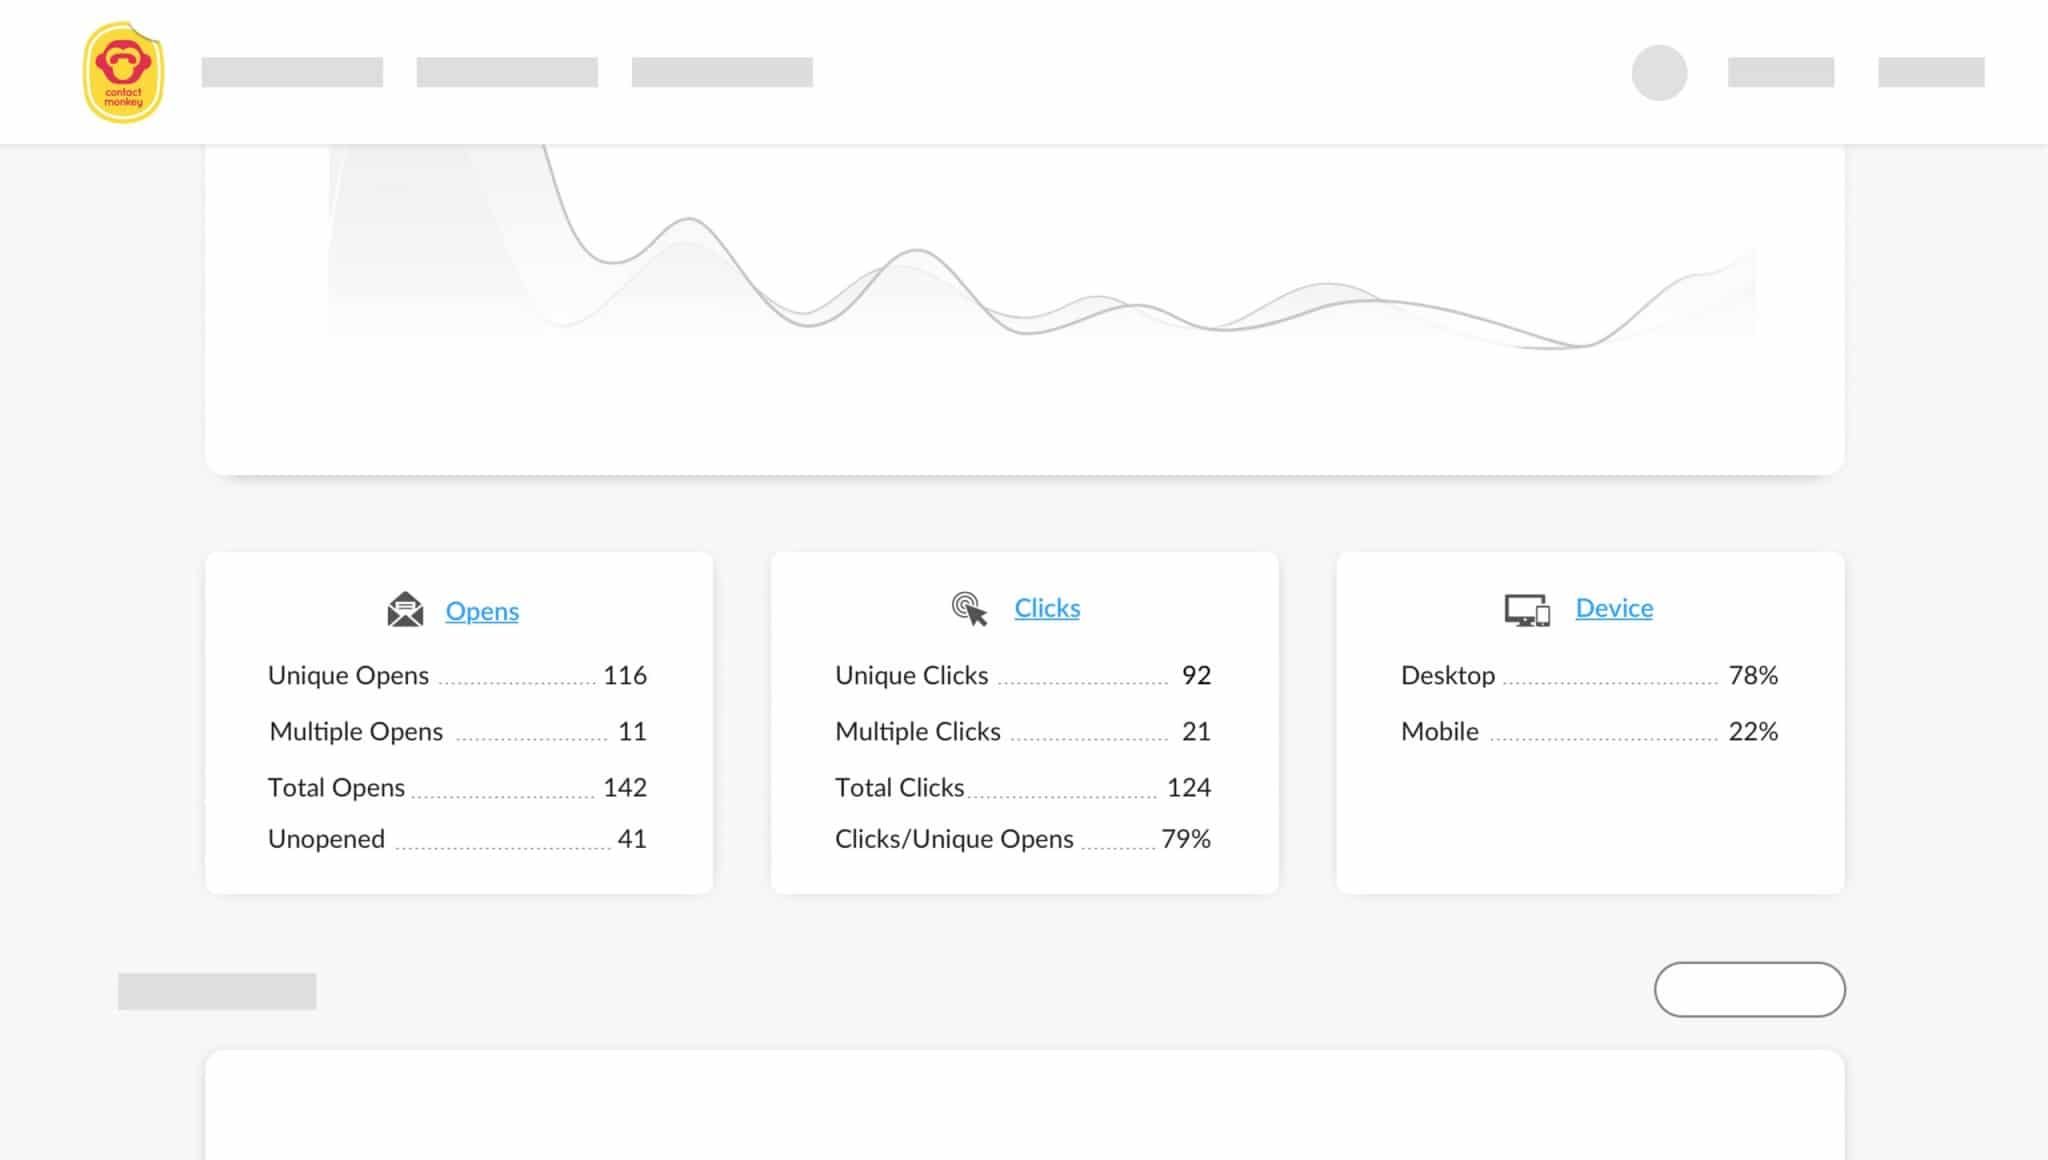
We’ve updated the look and feel of the graph on the campaign overview page. It’ll now be clearer to understand opens and clicks over time from your campaigns.
Our graph now allows you to alternate between “Opens” or “Clicks” view by simply selecting the “blue” Opens square or “pink” Clicks square at the bottom tile of the graph.
Campaign Overview Page with Detailed Information
We’ve added more detail to the tiles underneath the graph within the campaign overview page. You will now be able to see more information in regards to your campaign related to opens, clicks, and devices used.

Bug Fixes
- Fixed the User Interface for Best Performing links section.
- Fixed an error to loading of the dashboard within Internet Explorer.
Are you looking to get started with measuring employee engagement from your Outlook or Gmail inbox? Book your free personalized demo and start sending and measuring better employee newsletters from Outlook and Gmail!


